


Transforming the Real Estate Industry Using Technology
Canadian Property Valuation Magazine
Search the Library Online

The real estate industry, especially the valuation side, is about location, location, location. How many times have we heard that term expressed in our day-to-day work within the industry? However, the significant reality with the statement is that, although we know it is true, we have not really used systems, technologies and workflows that are ‘influenced’ by geography (location).
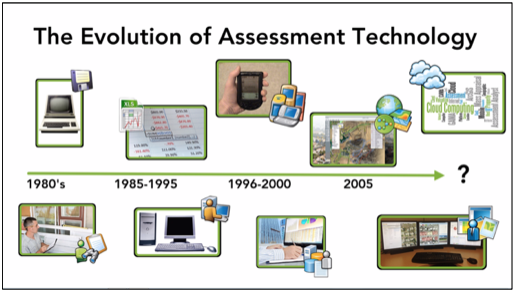
Figure 1
Figure 1 illustrates the evolution of technologies used in the property assessment industry over the last 30 years. The timeline demonstrates the rapid evolution of technology and how it is moving towards more geographic or location centric technologies.
Figure 2a
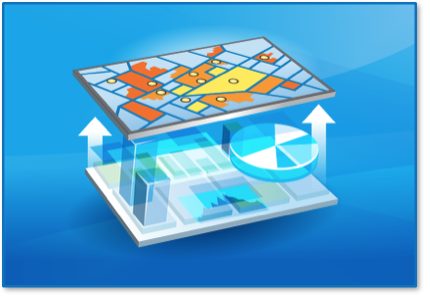
Although this article highlights key examples from the property assessment or mass appraisal side of the industry, the reality is that the concepts, applications and points pertain to most areas of the real estate industry, with minor amendments to the workflow or volumes of transactions. In other words, it is about taking our property information, spreadsheets, sketches and salient facts and placing them on a map (Figures 2a and 2b) allowing more analytical and location centric information and capabilities.
Figure 2b
Enter the world of Geographic Information Systems (GIS)
GIS leverages the fundamental principle of geography, i.e., that location is important in people’s lives. With the vast information sources available today, GIS is a key tool in determining what it all means. With so much information tied to a location, GIS helps find patterns/analysis that we might not see or explore without visualization.
Simply put, GIS takes the numbers and words from the rows and columns in databases and spreadsheets and visualizes them on a map. The use of maps to convey information adds an extra dimension to data that might not jump off the page in a simple list or spreadsheet. It allows you to view, understand, analyze, interpret and visualize your data in ways previously not possible. The visual aspect of a map provides unprecedented insight and knowledge about an organization’s assets and workflows.
Computer Assisted Mass Appraisal (CAMA) systems throughout the world use models in some form to value properties. What a model represents is an equation or relationship between the value of a property and the various components (data) that influence and make up that value. Therefore, mass appraisal models represent the equation which influences value for a specific location. As a result, geography is a critical and integral element that cannot be ignored in a CAMA system.
GIS and CAMA systems are both technologies that have been around for a few decades. However, for various reasons, there is slow adoption of more intermediate and advanced uses of GIS within the real estate industry at large. This slow adoption has limited the true power and sophistication of GIS in the assessment industry and its business processes, which is especially concerning when we go back to the earlier statement of the importance of location, location, location.
A noticeable performance gap in the industry is that real estate software applications typically operate independently from each other, leaving users to interact with each one manually as an isolated database. Whether they are doing individual appraisals or mass appraisals, appraisers require some key information such as data, photographs, orthographic (air photo) images, maps, zoning layers and building sketches. The best result for an appraiser is to have and be able to utilize this salient information at the same time. Having this information in stand-alone systems and technologies leaves silos of data, little to any integration and a cumbersome workflow.
Leveraging technology with integration
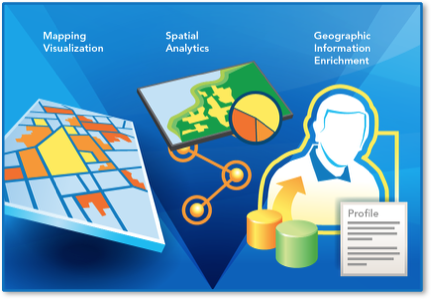
The advantage of containing and referencing all the required real estate data (images, data, maps, layers, etc.) into one common database, otherwise known in GIS circles as a geo-database (Figure 3), is that the appraiser or specialist can readily obtain more precise and correct information. The ability to do this quickly with more robust, detailed and precise information, with the added advantage of spatial representation (GIS/geography/location), allows the leveraging of technology.

Full and complete integration of technology (GIS) and data (property data, imagery, etc.) allows the appraiser to select or query a property and have the entire relevant information load instantaneously. This then allows him or her to review that data and or edit building sketches directly in the GIS system. A rich integration can go even further by attaching a valuation equation to the database by neighbourhood or market segment, thus allowing a full, on-the-fly valuation directly at the desktop. As the data is reviewed and edited, the contributory value to the property is directly reflected in the valuation on the fly. This rich integration represents a new paradigm for Automated Valuation Models (AVMs), providing the visualization for the appraiser in addition to the data and output.
There is definitely movement towards desktop review replacing costly field visits. In some situations, especially in the realm of mass appraisal, there is a movement towards desktop or office valuations. Having said that, there are times when these types of valuation or data reviews would not be appropriate for the valuation assignment. When they are relevant, a desktop review can dramatically increase production rates (valuations/reviews per day). Most jurisdictions conducting a desktop review can complete a review in approximately 10 minutes, whereas a site visit can take approximately 40 minutes, not including travel.
A composite desktop review solution provides powerful visualization and analytics, while building effective workflow tools for the appraiser. The ultimate solution can enable users by providing technology that allows them to pan around neighborhoods and click on land/property parcels to access all of the information that is required to perform or review the appraisal or assessment. Information about the property, such as current value, neighborhood and land use coding, is presented in conjunction with property characteristics such as roof cover, square footage, pool and garage. In addition, supporting information such as permit and sale information is also linked to the property.
Coupled with the salient property information, other datasets are presented, such as building sketches, which are geo-referenced to show data discrepancies and provide change detection analysis. Street front/oblique imagery is also integrated and used to visualize a building from many different angles. Functionality to zoom in and out of street front photos in order to get a clear look at a property and surrounding infrastructures is included in the application. Using the powerful visualization and analytics tools, users can quickly identify new construction and demolitions and conduct market segmentation, property use and market variable analysis.
Using a desktop review system, the appraiser has the ability to audit, cleanse, detect and resolve existing data issues and more effectively calibrate the correct valuation. By combining the use of things like oblique imagery into the workflow, users can conduct measurements and make corrections to the corresponding building sketch, adjust line work on the building sketch and have the changes populate the database. Through sketch verification, building sketches can be compared with aerial photography to check for anomalies and spot new construction or other changes that could be constructed without a permit.
Where does data creation start? In real estate valuation, the appraiser often requires a starting point of data and, more often than not, the process begins with defining and validating the area (square feet/meters) of the building(s). This brings us to evolutions in building sketching technology.
When I first started doing appraisals, I measured buildings on site using a clipboard and pencil. I would take the measurement of a wall and rough sketch it on a pad of paper. Upon return to the office, I would then use graph paper to draft a to-scale good copy sketch and calculate the area of the structure. Unfortunately, since balance or a measurement could be written down incorrectly, sometimes the sketch would not line up. Since that time, software systems have been built that allow the user to enter lengths and directions and record the sketch electronically instead of on paper. With this electronic approach, the software provides some increased functionality to the user over pencil and paper, but can that functionality be increased?
New technological evolutions in the area of sketch creation and editing have occurred using the power of a GIS. Sketch creation and edit capability in geographic space allows the ability to maintain that sketch within the coordinates (x,y) of the building’s location on the earth. This allows a geo-referenced building sketch.
An example of this capability is ‘GeoSketch’ (Figure 4), which is a geospatial editing environment that is tightly integrated with the Assessment Analyst (desktop review) system. It enables users to sketch and edit buildings and other structures directly on the map. In other words, GeoSketch is a building sketch (geometry) editor in geo-referenced space.
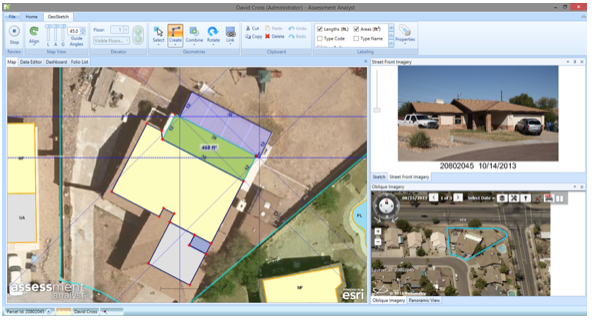
The sketch then becomes an editable layer within the GIS, which allows enhanced visualization using the map, as well as the sharing or consumption of this layer and data between users. The layer can be integrated with additional layers of data to allow analysis, geo-processing activities or data correlations as required by the user.
The key innovation of all these items such as the map, sketch, imagery, data and analytics is the fusion of disparate data sources into an integrated database with a flexible and responsive user experience driven visually from the map. The user is not constrained to a rigid series of steps, but rather is able to work with whichever information sources best illuminate the appraisal assignment for a given parcel or property. In short, the leveraging of technology into a GIS centric valuation database is about using the influence of geography to bring more information to the appraiser quickly, accurately and spatially.
Influence of geography on real estate
The significant advantage to a geographic centric database is the ability to have not only the integrated information, but the ability to analyze the effect geography has on the value of a property.
The example in Figure 5 provides the spatial output (map) of using defined sales to extrapolate and predict the valuations of the unsold properties while representing the market areas for the entire population. In this example, a defined set of sales was used to predict the values of all properties in Maricopa County, which incorporates Phoenix and surrounding cities.
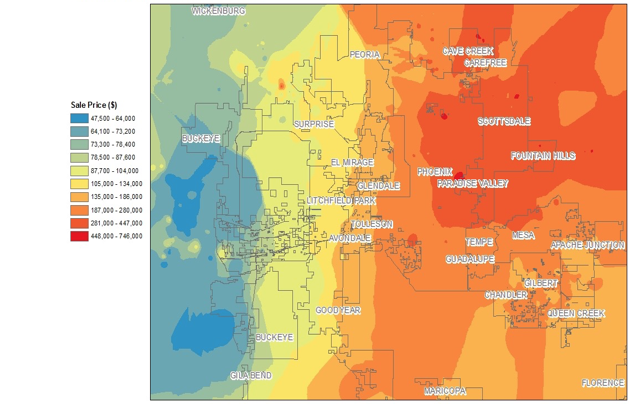
Geo-processing is a GIS operation that can be used to process, analyze and manipulate spatially related data. Ultimately, the use of it allows for definition, management and analysis of information which can be used to form decisions and actions.
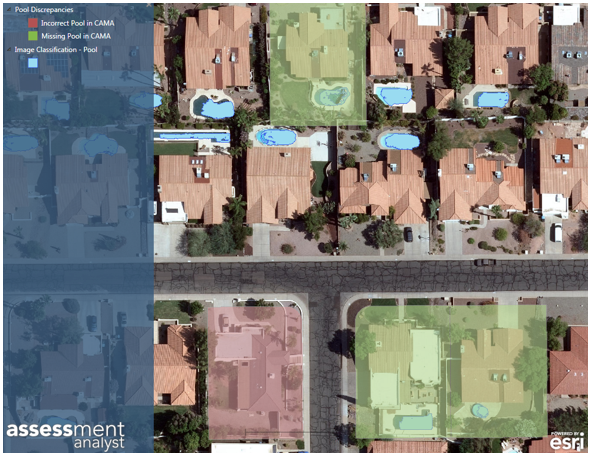
An example of how geo-processing is used can be better understood by the image in Figure 6. In this example, geo-processing (an algorithm) was used to read the ortho image (air photo) and detect where a swimming pool ‘might’ exist on a property. This layer was then compared to the actual ortho image as well the appraiser’s current data set (assessor’s data in their CAMA system) to determine where a pool was correctly assessed, or where there was a discrepancy between the assessor’s data and what was actually on the ground.
This evolution of technology is allowing the user to run an automated process to conduct a check/inspection on property data rather than having to visit each property independently. In this situation, approximately 1,000,000 homes in Maricopa County had this automated review completed in hours through geo-processing vs. the alternative of literally decades of time if an appraiser had to visit each property independently.
Where does this technological innovation in real estate software systems end? Is there more? The short answer is that it is not ending and it gets even more sophisticated with the introduction of 3 Dimension (3D) to the equation.
3D is a new and emerging area of GIS technology. As seen in Figure 7, typical 3D work in GIS to date presents cityscapes or scenes that are simple building polygons (circled in white) normally extruded from the building footprint.
Although nice to look at, this simple type of building polygon and cityscape presents only a visual scene. The practical application, usefulness and value of these simple buildings and the resulting scene are limited for the real estate industry. However, the capability exists to develop a more complex building (circled in red), which, in this example, is comprised of actual strata condominium units that are physically correct to the strata plan and spatially correct to the unit’s place on earth. This complex use of 3D GIS will bring more value to the user.
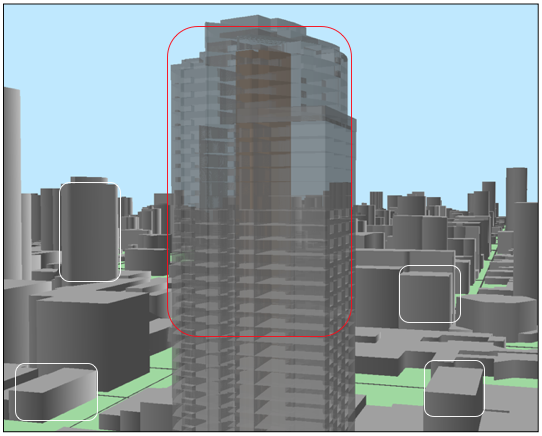
Figure 7
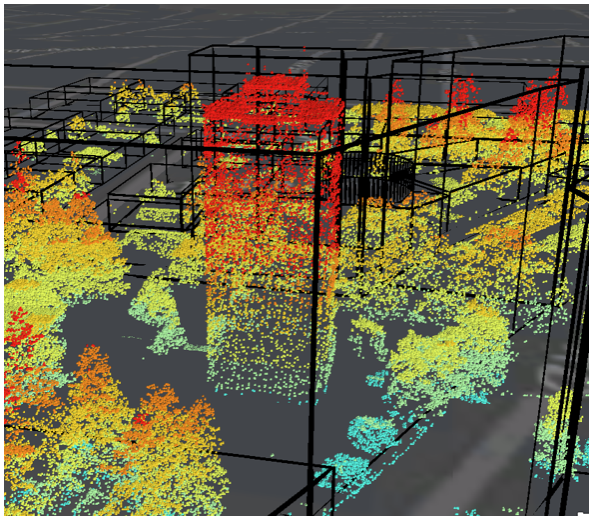
What is equally compelling is the integration of data sets into GIS such as LiDAR (Light Detection and Ranging), which present point clouds to denote things like buildings and vegetation. The user then has the ability to determine things like density (actual vs. allowed) by performing 3D analysis within that GIS centric property database (Figure 8).
Figure 8
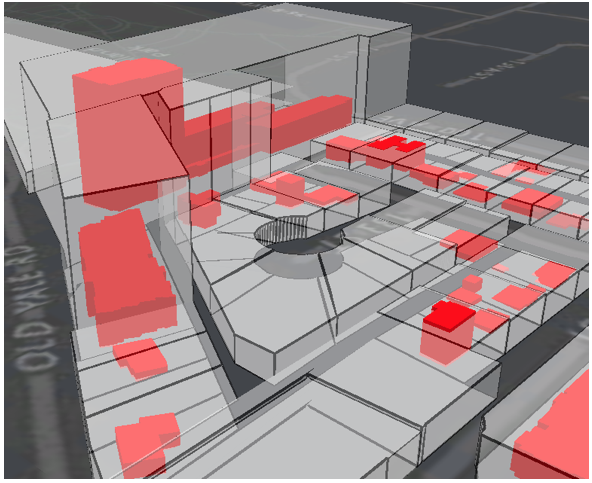
Visualization within 3D GIS (x,y,z coordinates) provides the capability to see and understand information that is not readily apparent in a spreadsheet or report. In the Figure 9 image, the grey shape represents in 3D the allowable height of building for that lot. The red shape is a 3D extrusion of the main floor of the building and identifies the true height of the current structure on the lot. The actual height of the building can be determined through different data sets such as photogrammetry, LiDAR and oblique imagery.
Figure 9
These types of technological innovations are also proving to be a benefit to multiple stakeholders in the real estate industry. For example, planners are looking at 3D GIS as a way to determine the future growth and look of cities. The image in Figure 10 shows how the use of 3D GIS can determine the overall heights of a city by property type and zoning/planning designation. One of the largest advantages is the ability to conduct ‘what-if’ scenarios to influence policy and direction.
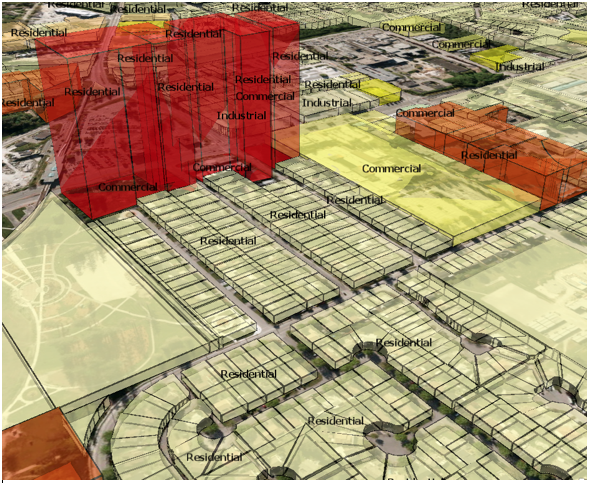
Figure 10
How realistic is 3D GIS valuation?
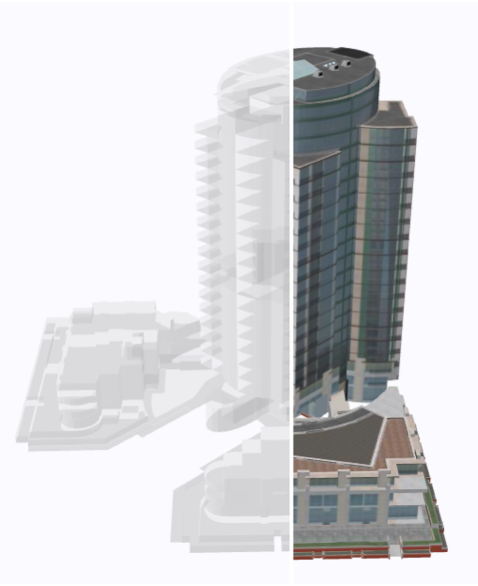
Figures 11a and 11b
The screen shots in Figures 11a and 11b illustrate how realistic nature of 3D GIS city scenes. They are realistic in terms of being physically accurate to the building strata plan, spatially as the physical structure exists in a scene using x,y,z coordinates, and visually by incorporation of imagery and building texturing using procedural rules within the scene.
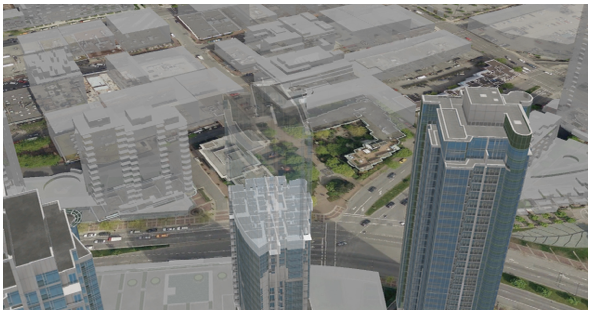
Complex buildings are then able to generate entire city scenes such as Figure 12, which is Vancouver, BC.
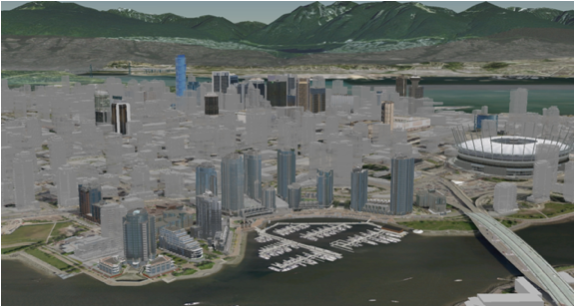
Figure 12
The next step for the appraiser or real estate industry stakeholder is to utilize the scene to search out relevant information and visually map that information, such as comparable sales for a building (Figure 13) and entire databases for an entire city scene (Figure 14).
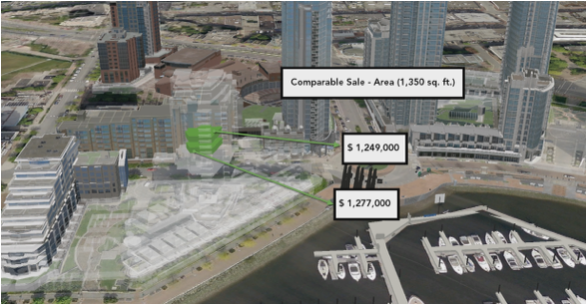
Figure 13
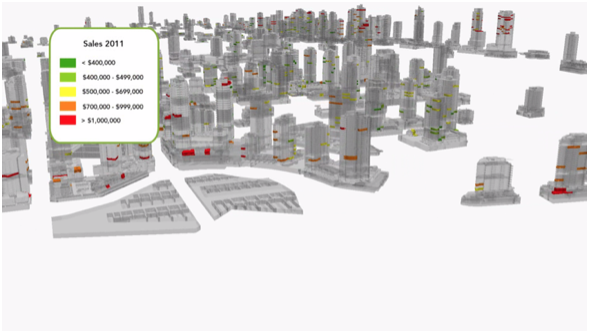
Figure 14
Geo-processing and automated workflows can then be used to value entire cities using embedded software such as Multiple Regression Analysis (Figure 15).
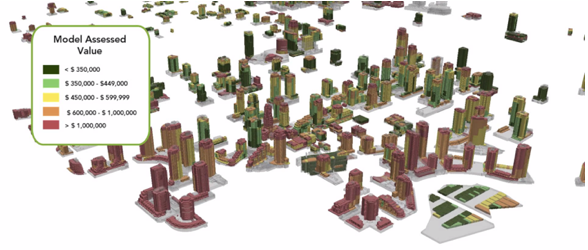
Figure 15
Over the last 30 years, technological change has rapidly advanced real estate software systems and applications used by the appraiser, assessor and real estate professional. The timeline, degree and pace of change provide a clear indication that the future will grow further from these technologies now in use today.
The future will include more evolution towards automation or workflows, thereby freeing the single or mass appraisers to perform more reconciliation of the output and calibration of the tools. This allows them the ability to spend more time in analysis rather than on building or analyzing the data.